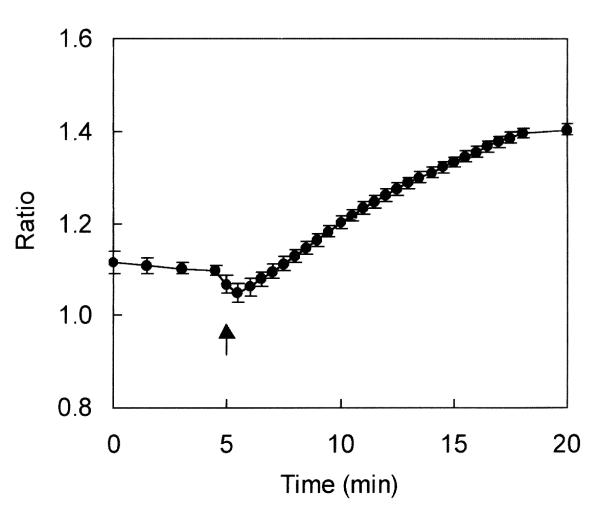
Figure 4.
Changes of [Ca2+]i level in SaOS-2 cells kept under pressure (1 atm) following ethylene gas exposure. Ethylene gas was injected into the pressure chamber 5 min after starting fluorescence measurements (arrow). The values for the ratios of the 340/380 nm images are shown. The results are expressed as mean values ± S.E.; n = 20.

