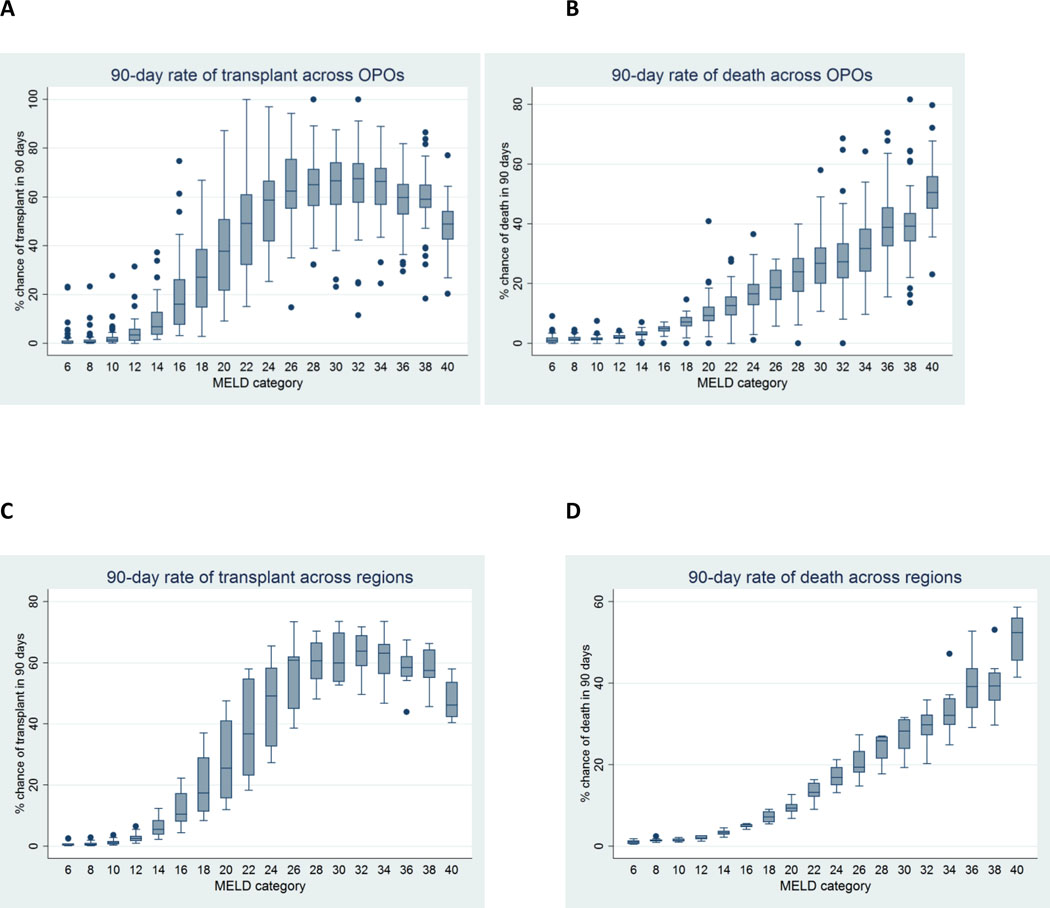
Figure 5. 90-day rates of transplantation and death while waiting, by initial allocation aMELD score, across OPOs (5A, 5B) and regions (5C, 5D).
Each box plot represents two aMELD points (e.g. the left most box represents aMELD scores of 6 or 7), except for the right most box which represents patients with an aMELD of exactly 40.

