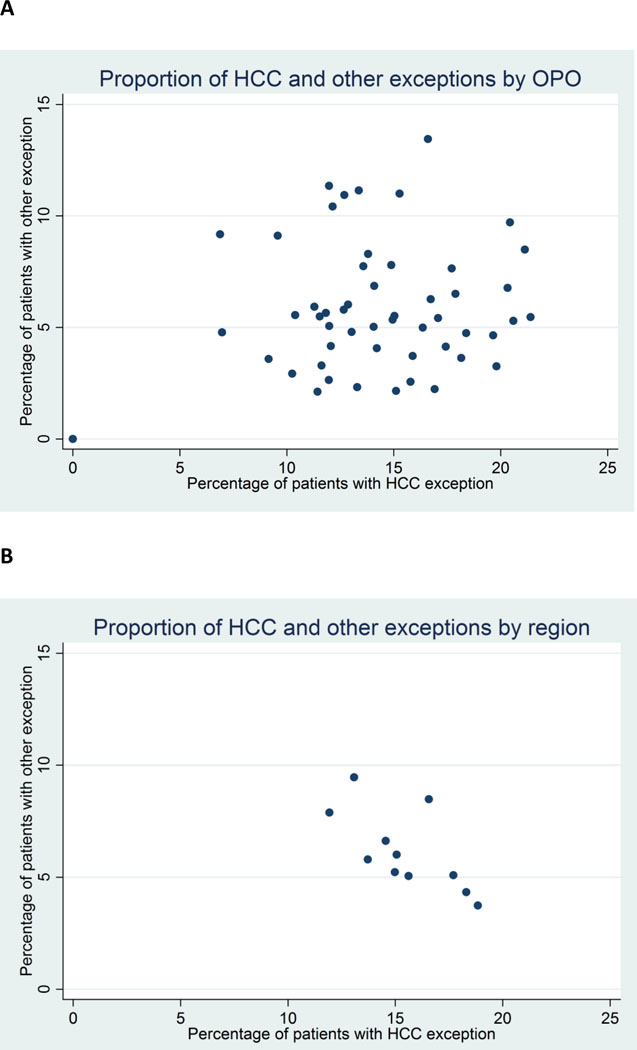
Figure 6. Proportion of patients who received HCC and other exceptions, by OPO (6A) and region (6B).
HCC exceptions are more common than other exceptions. The proportion of HCC exception shows no apparent relation to the proportion of other exceptions at the OPO level (correlation coefficient = 0.14), but is inversely related to the proportion of other exceptions at the regional level (correlation coefficient=−0.67).

