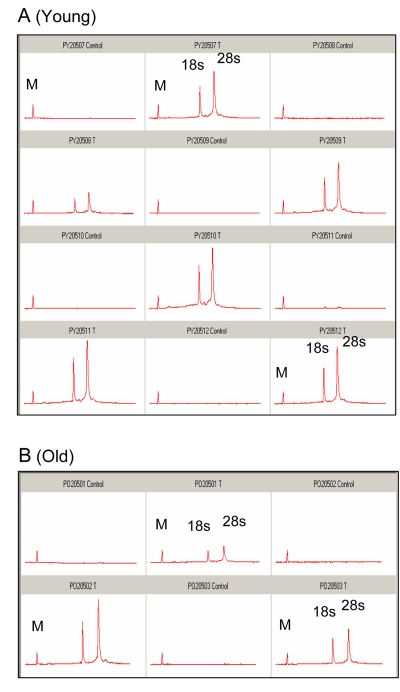
Figure 3. Analysis of total RNA from control and ischemic plantaris muscle following 5 days of reper-fusion.
An equal percentage of total RNA from (A) six separate samples of young (6-7 months) and (B) 3 separate samples of old (24-27 months) plantaris muscle was analyzed by capillary gel electrophoresis. The initial peak is a marker (M) included for calibration. Control and I/R samples are the contralateral and ischemic muscle from the same animal. Samples are paired from left to right, beginning with control. C = control; T = I/R; small ribosomal subunit (18s) and large ribosomal subunit (28s).

