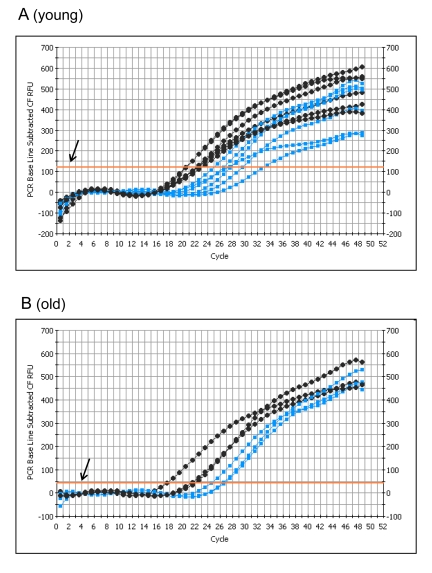
Figure 4. PCR analysis of GAPDH transcript levels from control and I/R plantaris muscle following 5 days of reperfusion.
PCR with GAPDH specific probes was performed using an equal percentage of total cDNA (reverse transcribed from mRNA using igo(d)T primers) isolated from each sample of (A) young (6-7 months) and (B) old (24-27 months) plantaris muscle. Control = black; I/R = gray; T = Threshold (arrow shows the threshold).

