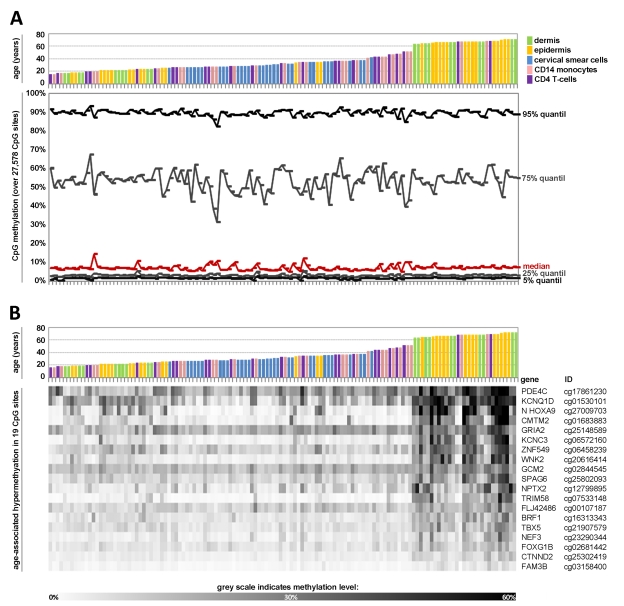
Figure 1. Age-associated DNA-methylation changes at specific CpG sites across different tissues.
Quantile analysis of beta-values in the 5 datasets of the training-group comprising: dermal cells (predominately fibroblasts), epidermal cells (keratinocytes), cervical smear cells (epithelial cells), and blood (monocytes and T-cells). The global distribution of DNA-methylation did not differ markedly with age or across different tissues (A). Pavlidis Template Matching (PTM) identified 19 CpG sites with age-associated hypermethylation (R > 0.6; p-value < 10−13) (B).

