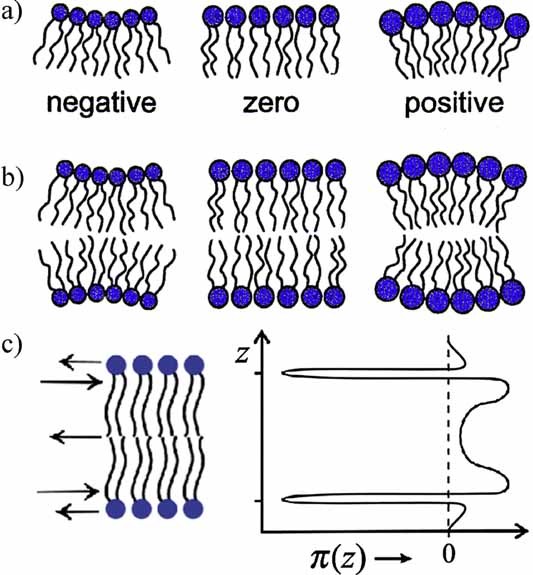
Figure 5.

(a) Lipid monolayers with negative, zero, and positive (from left to right) curvature determined by the conicity of the lipid molecules. (b) Stable lipid bilayer (middle) formed by two opposing lipid monolayers. If the monolayers were not constrained by being in the bilayer, they may want to curve as shown to the left and the right, in which case the middle stable bilayer would suffer from a built-in curvature stress. Courtesy of Dr. Olaf Sparre Andersen. (c) Schematic illustration of the lateral pressure profile, π(z), of a lipid bilayer, revealing regions of expansive (positive) pressures and regions of large tensile (negative) pressures.
