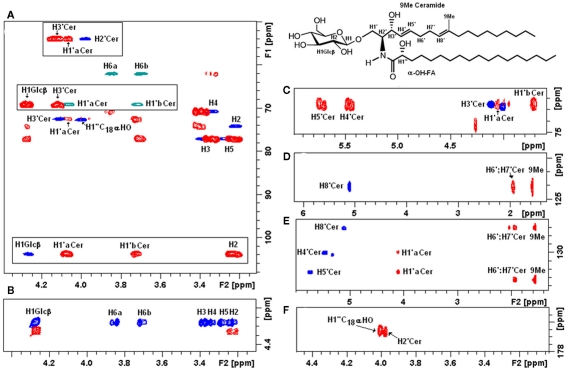
Figure 7.
Two-dimensional NMR fingerprints of F. oxysporum CMH observed by homonuclear and heteronuclear experiments. (A) Overlaid representation of fingerprint assignments of partial edited HSQC and HMBC spectra; positive phase (blue) correspond to CH and CH3 carbons, negative phase (green) correspond to CH2 carbons, in (red) HMBC cross peaks; (boxes) represent glycosyl-ceramide linkage zones fingerprints. (B) Partial TOCSY (blue) and COZY (red) spectra from the anomeric region showing the main cross peaks of the carbohydrate ring, observation of the total 1H–11H axial correlations and reach the monosaccharide composition. (C–E) HSQC and HMBC slices of unsaturated carbons in ceramide moiety. (E,F) Fingerprint slices of the quaternary carbons (C-9) and amide linkage at 136.4 and 176.5 ppm, respectively.

