Figure 4.
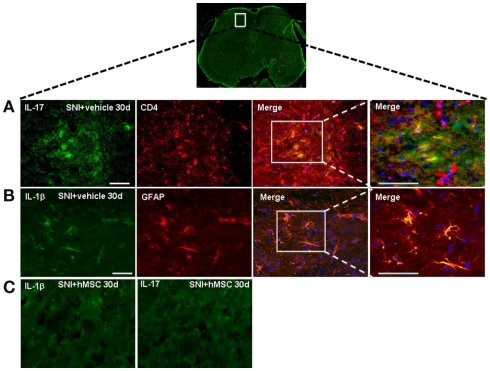
Representative cross-section of mouse L4–L5 spinal cord from 30 days-neuropathic mice. (A) First: IL-17 positive profiles (green fluorescent) in vehicle treated 30 days-neuropathic mice (SNI + vehicle). Second: CD4 positive profiles (red fluorescent) in vehicle treated 30 days-neuropathic mice. Third: double labeling of IL-17 and CD4 positive profiles. Fourth: higher magnification showing that the cells expressing IL-17 were T lymphocytes. Cell nuclei were counterstained with DAPI (blue fluorescence). Scale bars: 100 μm. (B) First: IL-1β positive profiles (green fluorescent) in vehicle treated 30 days-neuropathic mice. Second: GFAP positive profiles (red fluorescent) in vehicle treated 30 days-neuropathic mice. Third: double labeling of GFAP and IL-1β positive profiles. Fourth: higher magnification indicating that the cells expressing IL-1β were astrocytes. Cell nuclei were counterstained with DAPI (blue fluorescence). Scale bars: 100 μm. (C) First: IL-1β profiles (green fluorescent) in hMSC-treated 30 days-neuropathic mice (SNI + hMSCs). Second: IL-17 profiles (green fluorescent) in hMSC-treated 30 days-neuropathic mice (SNI + hMSCs). The absence of positive staining indicates that injected hMSCs were able to reduced the protein levels of pro-inflammatory interleukins IL-1β and IL-17, confirming western blot analysis results.

