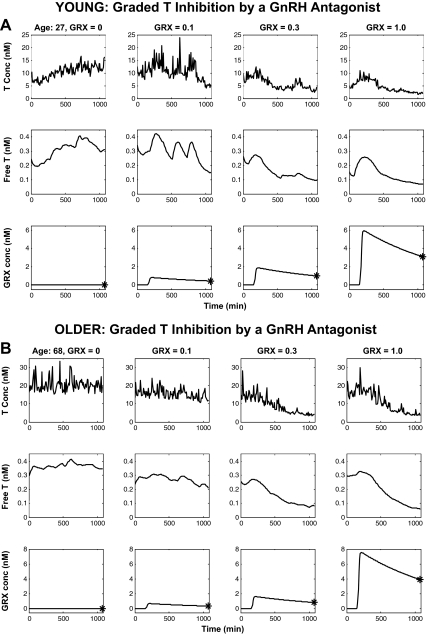
Fig. 3.
A and B illustrate data respectively obtained in younger and older men. Measured T concentration (top), calculated T secretion rate (middle), and time-varying extrapolated GRX concentration (bottom) profiles matching the LH profiles of Fig. 2.

