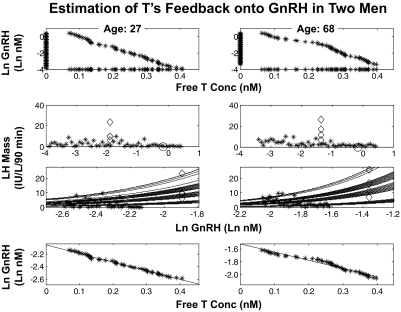
Fig. 4.
Estimation of T's feedback onto GnRH secretion in a young (age 27 yr) (left) and older (age 68 yr) (right) man. If one observed all the components (LH secretory-burst mass, modal GnRH concentration, free T concentration, and GRX concentration), one could then estimate the logistic dose-response parameters and the negative dependency of GnRH on free T. If one does not observe GnRH, the estimation can still be performed if one additionally requires that the estimated GnRH values have a reverse monotonicity to free T. The details are given in Materials and Methods and Results. The top two rows are steps in the construction of starting values for model estimation, whereas rows three and four are the result of such GnRH and dose-response parameter estimation (for two subjects). First row, The y-axis gives the 48 starting values (90-min time blocks) for endogenous ln GnRH concentrations (asterisks on the y-axis line), assuming initially that values are uniformly distributed between ln (0.1 × GnRH bolus mode) and ln (2 × GnRH kd). The x-axis gives the 48 calculated free T concentrations in the same 90-min time blocks (asterisks on x-axis line) maintaining an inverse monotonicity with ln GnRH. The middle-two rows give regressions of deconvolution-calculated LH secretory-burst mass (IU/liter per 90 min) on measured ln GnRH (nm) modal concentrations. Second row, Exogenous GnRH-driven LH secretory-burst responses are identified by rhomboids (x-axis values are directly measured peak GnRH concentrations after iv injection), and the GnRH kd is marked by the x-axis circle. Initial estimates of endogenous GnRH-driven LH responses are denoted by y-axis asterisks (n = 48). Rows three and four, 1) The family of GRX-shifts of the estimated logistic dose-response function of LH burst mass regressed nonlinearly on ln GnRH (T-inhibited) concentration, and 2) a plot (and linear regression) of ln GnRH against free T concentration. The model estimates the right-shifted dose-response functions linking ln modal GnRH concentrations (x-axis) with LH secretory-burst mass (y-axis) at each of four GRX concentrations (row three, multilined curved bands). Linear regression relates ln modal GnRH concentration ranked in descending order to free T concentration ranked in ascending order (row four, lines). The slope of this regression is a measure of hypothalamic GnRH's sensitivity to T inhibition, and the y-intercept is a measure of maximal (ln) GnRH secretion as free T concentrations approach zero. The slope and the y-intercept terms are regressed on age in Figs. 6 and 7. conc, Concentration.

