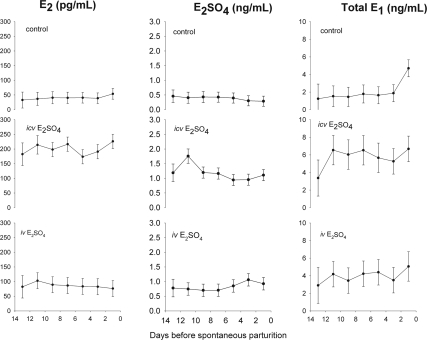
Fig. 2.
Plasma E2 (left panels), E2SO4 (middle panels), and total (conjugated plus unconjugated) E1 (right panels) concentrations in chronically catheterized singleton ovine fetuses throughout the last 13 d of gestation. Fetal sheep were treated with no steroid infusion (control, top panels), estradiol sulfate icv (middle panels), estradiol sulfate iv (bottom panels). Values are represented as mean ± sem.

