Figure 1.
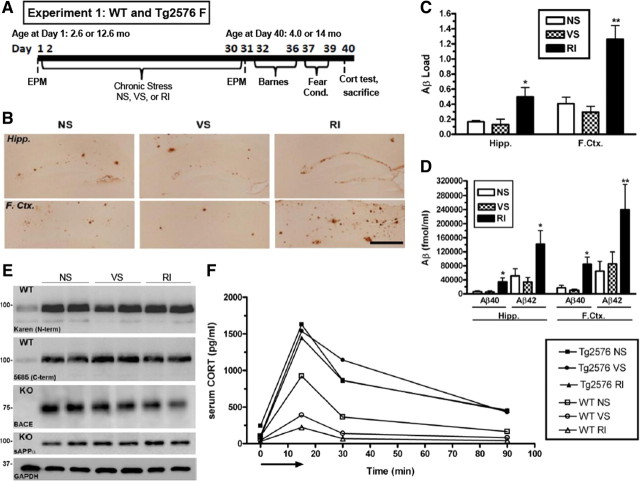
Chronic RI stress exacerbates Aβ levels in stress-sensitive Tg2576 mice. A, Experimental design of experiment 1; WT and Tg2576 female mice (n = 10 per group) were exposed to NS, VS, or RI stress for 1 month. B, Representative images in the hippocampus (Hipp.) and frontal cortex (F.Ctx.) show increased Aβ-IR in RI mice, quantified in C (F(3,18) = 5.61, p = 0.014; and F(3,24) = 15.64, p < 0.0001). Data show mean ± SEM Aβ load. D, By ELISA, insoluble Aβ40 was significantly increased by RI in the hippocampus (F(5,28) = 4.47, p = 0.005) and frontal cortex (F(5,28) = 2.08, p = 0.11), as was Aβ42 in the hippocampus (F(2,21) = 6.51, p = 0.007) and frontal cortex (F(2,15) = 12.4, p = 0.001). Data show mean ± SEM Aβ levels (n = 8 per group). E, Hippocampal protein levels of APP, sAPPα, and BACE were measured with either WT or BACE KO mouse hippocampal homogenate (n = 2 per group) as a negative control. In 14-month-old Tg2576 mice, neither stress altered hippocampal levels of 5685, Karen, BACE, or sAPP. F, CORT levels were plotted over time after an acute 15 min restraint stress (arrow) in 4-month-old WT and Tg2576 mice. In WT mice, both VS (F(5,28) = 4.9, p = 0.05) and RI stress (F(2,20) = 1.3, p = 0.31) decreased the area under the curve compared with NS. However, CORT levels were elevated significantly in all conditions of Tg2576 mice, regardless of stress treatment. Data show mean (n = 10 per group). *p < 0.05, **p < 0.0 1 from NS. Scale bar, 0.5 mm.

