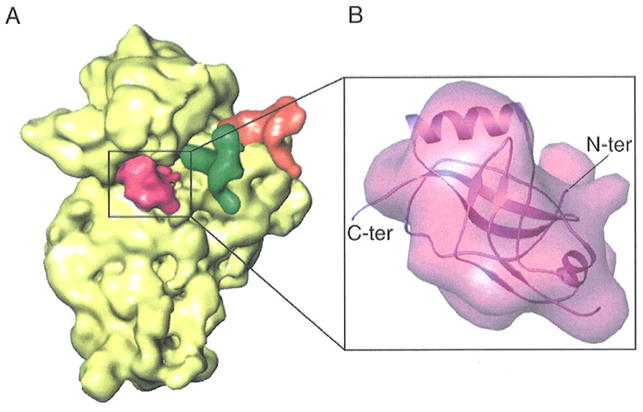
Figure 2.

Location and interpretation of density attributed to SmpB. (A) Cryo-EM map of SmpB bound with the 30S subunit, obtained by computational separation from the map shown in fig. 1B. SmpB is shown in red, and P- and E- site tRNAs are in green and orange, respectively. The 30S subunit is depicted in yellow. (B) Density attributed to SmpB, shown in the same orientation as in (A), and docked atomic coordinates shown in Ribbons representation. Coordinates are from PDB code 1P6V. The N- and C-terminal ends of SmpB are indicated.
