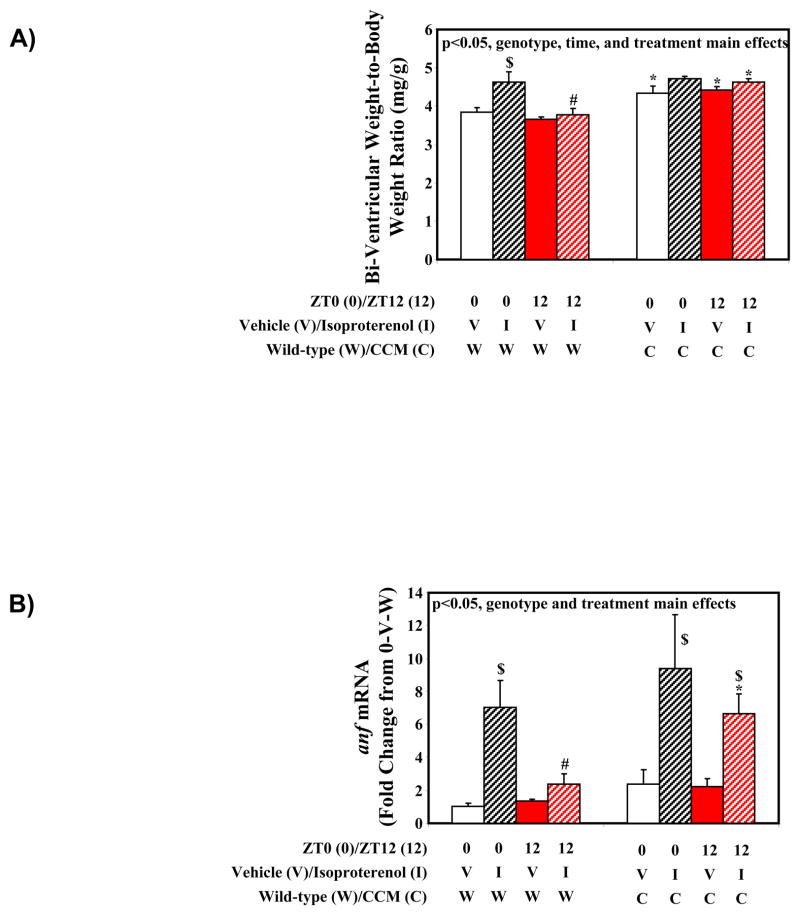
Figure 6.
Gravimetric (A) and gene expression (B) markers of cardiac hypertrophy in wild-type and CCM mice administered with isoproterenol in a time-of-day-dependent manner. Values are expressed as mean ± SEM (n=3–9). # denotes p<0.05 for ZT0 versus ZT12 hearts within the same treatment and genotype groups. $ denotes p<0.05 for vehicle versus isoproterenol treated hearts within the same ZT and genotype groups. * denotes p<0.05 for wild-type versus CCM hearts within the same ZT and treatment groups.

