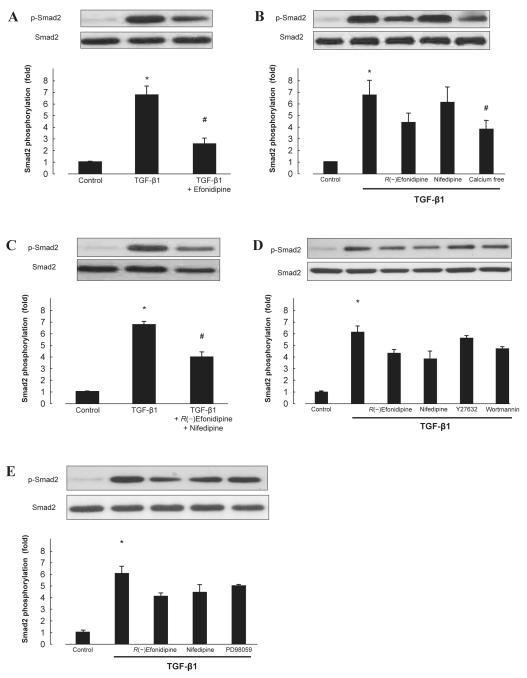
Fig. 3.
Effect of CCBs on TGF-β1–induced Smad2 phosphorylation in cardiac fibroblasts. Smad2 phosphorylation induced by TGF-β1 was measured in the absence or presence of efonidipine (10 μM) (A); R(−)efonidipine (10 μM), nifedipine (10 μM), calcium-free medium (B); combination of R(−)efonidipine and nifedipine (C); Y27632 (1 μM), wortmannin (100 nM) (D); or PD98059 (30 μM) (E). Bar graphs represent the mean ± S.E.M. (n = 6), expressed as the fold change in phosphorylation compared with unstimulated cells. *P < 0.05, control cardiac fibroblasts vs. TGF-β1 alone; #P < 0.05, TGF-β1 alone vs. TGF-β1 with treatment.

