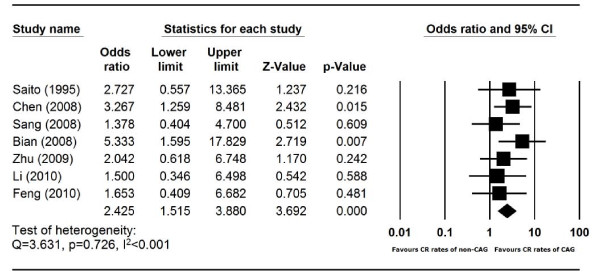
Figure 5.
Comparison of the CR rates of CAG regimen and non-CAG regimens in AML patients. Summary Odds ratio (OR) of CR rates of CAG regimen versus non-CAG regimen was calculated using the fixed-effects model. Horizontal lines through the squares represent 95% CIs. The diamonds represent the overall OR from the meta-analyses and the corresponding 95% CIs. An OR greater than 1 implies that the CR event is more likely in the CAG group.

