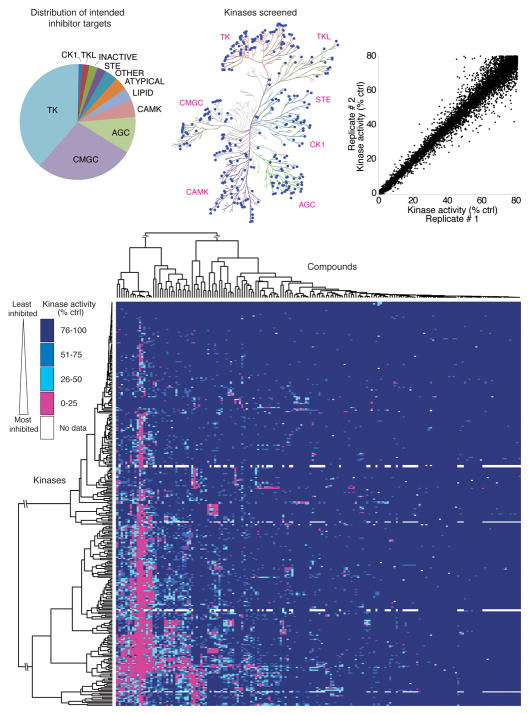
Figure 1.
Large-scale inhibitor-kinase interaction analysis. (a) Distribution of the intended targets of the inhibitor library, by kinase family. (b) The distribution of kinases in the screening panel is represented by blue dots on a dendrogram representing the human kinome (Kinome illustration was adapted and is reproduced courtesy of Cell Signaling Technology, Inc. (www.cellsignal.com) based on Manning et al.33). (c) Scatter plot of the kinase activity in replicate 1 versus replicate 2 for each kinase-inhibitor pair for which > 20% inhibition of kinase activity was observed. (d) Two-way hierarchical clustering analysis of the entire kinase-inhibitor interaction map presented as a heatmap of kinase activity. A fully labeled, high-resolution version of this heatmap is presented in Supplementary Figure 2, as a data table in Supplementary Table 3, and via the Kinase Inhibitor Resource (KIR) online tool (http://kir.fccc.edu).

