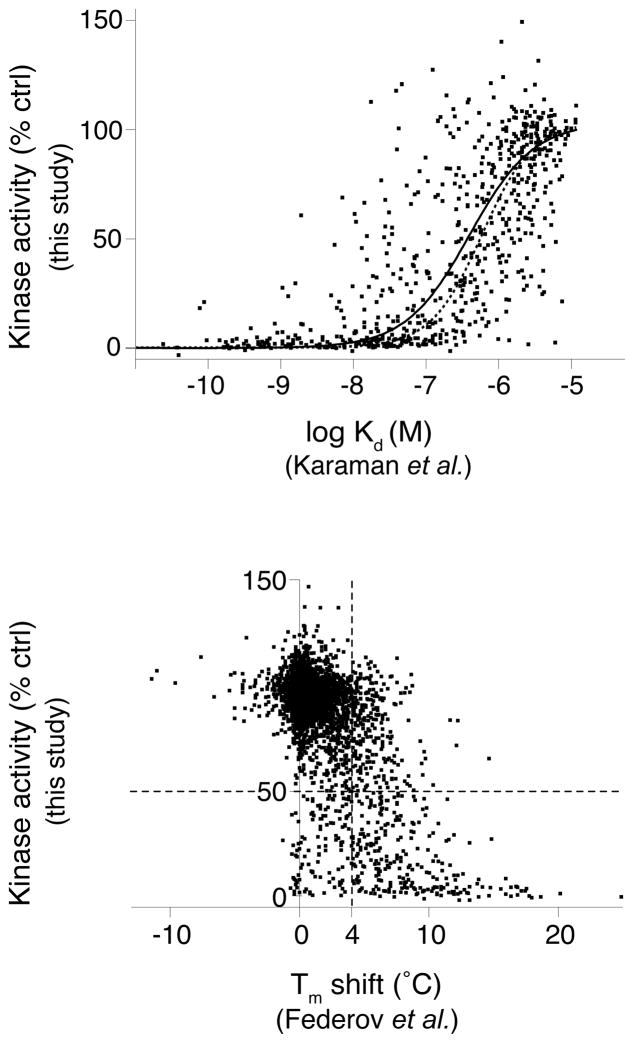
Figure 2.
Comparison of this study’s functional inhibition data with previous kinase-inhibitor interaction profiling studies. Scatter plots compare our results with studies that examined interactions of overlapping kinase-inhibitor pairs by (a) a quantitative kinase-inhibitor binding assay1, 2, or (b) an assay measuring resistance to thermal denaturation by kinases in the presence of individual inhibitors3. In (a), remaining kinase activity is plotted as a function of kinase- compound binding affinity (Kd) for 654 kinase-inhibitor pairs. The resulting data was fit to a sigmoidal dose-response curve (solid line) and can be compared with a theoretical curve (dotted line) for expected remaining kinase activity for an inhibitor of the given affinity. The theoretical activity curve was calculated according to the equation: activity=(100-(100/(1+(IC50/0.5 μM))) and the Cheng-Prusoff equation34 relating Ki and IC50. This calculation assumes a Hill coefficient of 1 for the binding and a Km,ATP of 10 μM for all kinases. In (b) remaining kinase activity is plotted against the change in melting temperature (Tm), relative to solvent control, caused by compound binding for 3,926 kinase-inhibitor pairs. The dotted vertical line denotes the Tm shift threshold used by Federov et al.3. The dotted horizontal line highlights the 50% threshold for inhibition of catalytic activity. The resulting upper right quadrant includes compounds that showed significant thermal stabilization without inhibiting kinase activity whereas the lower left quadrant contains compounds which only marginally affect thermal stability yet show > 50% inhibition of catalytic activity.

