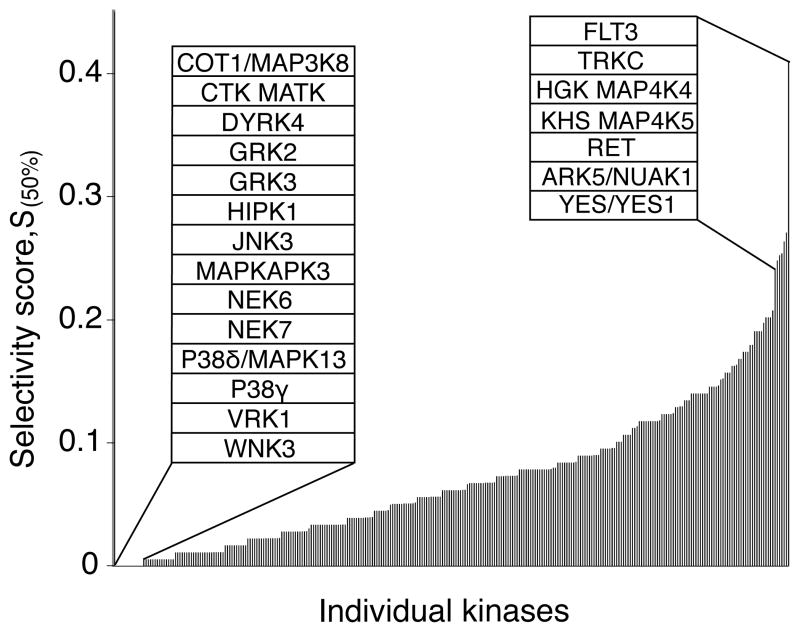
Figure 3.
Kinase selectivity. A ranked bar chart of Selectivity scores (S(50%)) for all tested kinases. This score corresponds to the fraction of all tested inhibitors that inhibit catalytic activity by >50%. Each bar represents the Selectivity score of an individual kinase. Insets identify the fourteen kinases that were not inhibited by any compound (left) and the top seven most frequently inhibited kinases (right). The complete table is presented in Supplementary Table 4.

