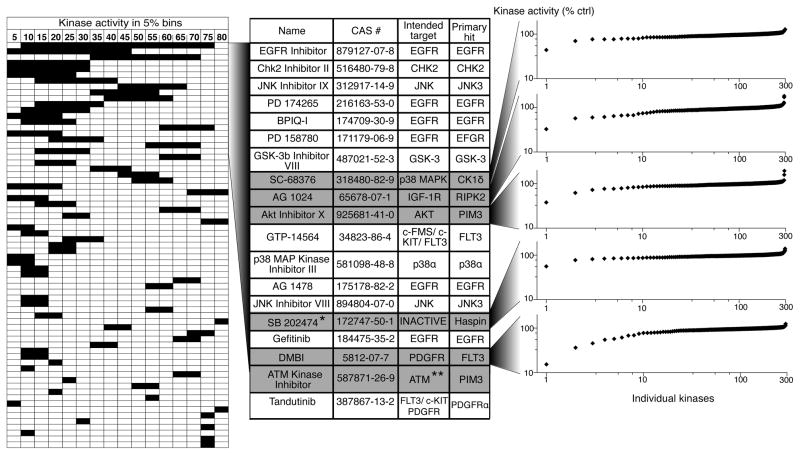
Figure 5.
“Uni-specific” kinase inhibitors. The left panel presents a graphical table of compounds ranked based on the compound’s ability to inhibit a single kinase significantly more potently than any other kinase tested. The left boundary of each horizontal bar depicts the potency with which the compound inhibits its most sensitive target and the right boundary reflects the potency with which the next most sensitive kinase is inhibited (% remaining kinase activity is shown in bins of 5%). Thus, the horizontal length of each bar reflects the differential activity of the corresponding inhibitor against its two most potently inhibited targets. Only compounds with a differential potency of at least 5% are shown. The central table identifies the compounds that showed at least 20% differential potency, their intended targets, and their most sensitive targets. Six compounds for which the most sensitive target is not the intended target are shown in grey. In the right panel, the effect of the individual compounds on each kinase in the panel is shown in a ranked plot. * SB 202474 is a negative control compound for the p38 MAP kinase inhibitor SB 202190. ** Note that ATM kinase was not included in our test panel.

