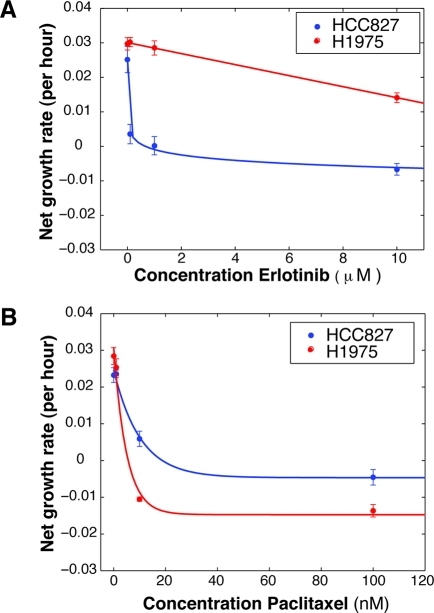
Figure 2.
Determination of growth rates during drug treatments. HCC827 and H1975 growth rates were calculated using the live cell counts determined in Figure 1 for a time period of 0–48 h at each concentration of (A) erlotinib (0.1, 1, 10 μM) and (B) paclitaxel (1, 10, 100 nM).

