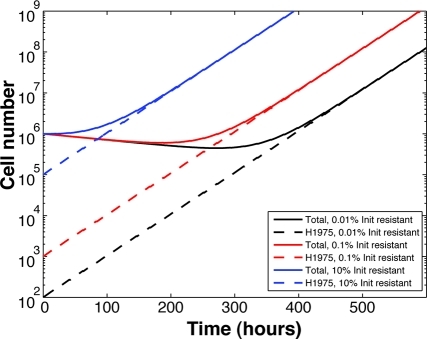
Figure 5.
Time to progression of disease for varying initial resistant fractions. Model predictions of total (solid) and H1975 (dashed) population size over time for populations starting with 0.01% (black), 0.1% (red), and 10% (blue) initial resistance frequencies. All predictions were conducted under a sequential alternating treatment schedule consisting of 3 μM erlotinib pulsed with 100 nM paclitaxel in a 1:20 ratio.

