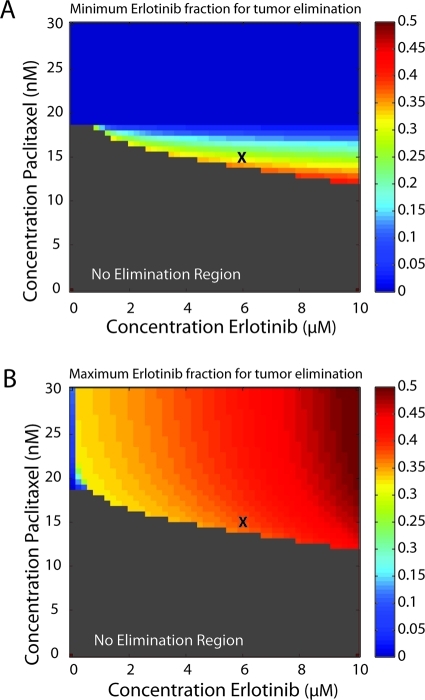
Figure 7.
Range of sequential paclitaxel–erlotinib schedules that can achieve elimination of the NSCLC cell population. (A, B) Minimal and maximal erlotinib fraction for sequential treatment strategies that achieve cell elimination for each dose-pair in the elimination (blue) region of Figure 6A. The initial population size in these maps was 106 cells with 0.1% initial resistance frequency.

