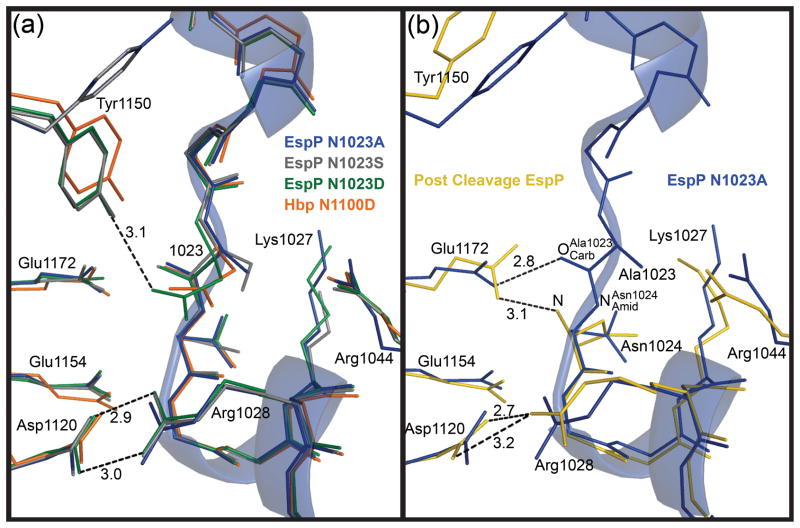
Fig. 2. Superposition of the EspP and Hbp cleavage sites.
The cleavage site region of the EspP N1023A mutant is shown as a transparent ribbon. For clarity, side chains are shown only for residues discussed in the text. These residues are labeled with EspP numbering. N1023A mutant, blue; N1023S mutant, gray; N1023D mutant, green; Hbp, orange; post cleavage EspP, yellow. Hydrogen bonds are shown as dashed lines and distances in angstroms are labeled. (a) Superposition of the pre-cleavage EspP mutants and Hbp. Tyr1150 is present in two different conformations. The salt bridge between Asp1120 and Arg1028 is shown for the EspP N1023D mutant. This salt bridge is present in all the EspP structures and Hbp. The hydrogen bond between Tyr1150 and Asp1023 is shown for the EspP N1023D mutant. (b) Superposition of the N1023A EspP pre-cleavage mutant and post cleavage EspP. The hydrogen bond between Glu1172 and is shown for the N1023A mutant. The hydrogen bond between Glu1172 and the N-terminus (N) and the salt bridge between Asp1120 and Arg1028 are shown for post cleavage EspP.

