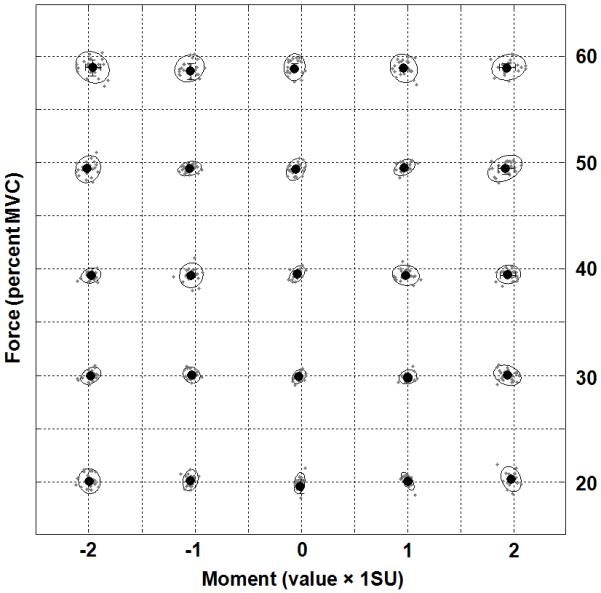
Figure 2.

Normalized FTOT and MTOT data during session-1. Force values were normalized by MVCIMRL, and moment values were normalized by 1SU (see Methods). The large black dots indicate average values across subjects with standard deviations bars, while the small gray dots nested in the ellipses represent normalized force and moment values for individual subjects. The ellipses were fit to contain more than 90% of experimental observations for each condition.
