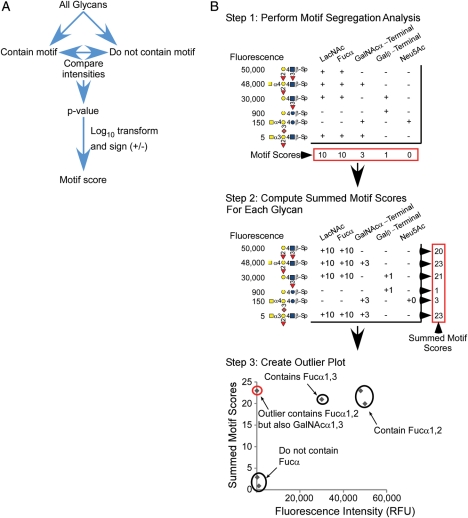
Fig. 1.
OMA. (A) Flow chart depicting the motif segregation method used to derive the motif scores. (B) OMA using demonstration data. The process begins with motif segregation analysis to assign a score to each motif (top). The next step is to sum the significant motif scores (>3.0) in each glycan to give a summed motif score for each glycan (middle). Next, the summed motif scores are plotted with respect to fluorescence intensity for each glycan. The graphical glycan notation conforms to the convention used by the CFG.

