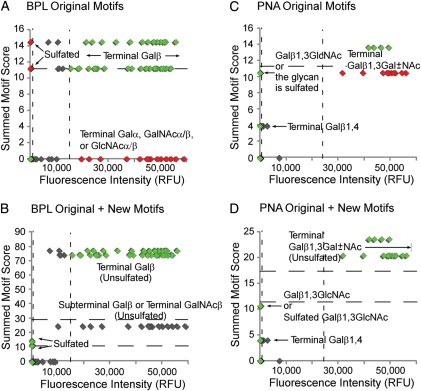
Fig. 3.
OMA of the galactose binders BPL and PNA. The summed motif scores for each glycan, after analysis with either the original or the updated motifs, are plotted with respect to fluorescence intensity after detection with BPL or PNA. (A) BPL using the original motifs. (B) BPL using the original plus new motifs. (C) PNA using the original motifs. (D) PNA using the original plus new motifs. The dashed lines represent the thresholds for defining outliers, based on the distributions from all the glycans (Supplementary data, Figures S1–S4). Symbols in the upper right sectors are the glycans in expected regions, symbols in the upper left and lower right indicate the outliers, and intermediate symbols indicate the bound glycans that may not represent the primary specificity of the lectin. Sp, spacer.

