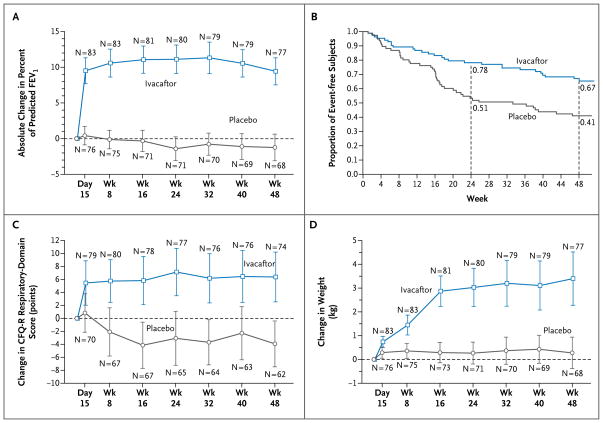
Figure 1. Changes from Baseline in Percent of Predicted FEV1, Respiratory Symptoms, and Weight, and Time to the First Pulmonary Exacerbation, According to Study Group.
Panel A shows the absolute mean change from baseline in the percent of predicted forced expiratory volume in 1 second (FEV1), through week 48. Panel B shows the time to the first pulmonary exacerbation, expressed as estimates of the proportion of subjects free from events. Panel C shows the absolute mean change from baseline in the score on the respiratory domain of the Cystic Fibrosis Questionnaire–revised (CFQ-R), a quality-of-life questionnaire that is scored on a 100-point scale, with higher numbers indicating a lower effect of symptoms on the patient’s quality of life. The established minimum clinically important difference for the CFQ-R respiratory domain is 4 points. Panel D shows the absolute mean change from baseline in weight, through week 48. The values and the 95% confidence intervals (indicated by I bars) in Panels A, C, and D are unadjusted. The first data points in Panels A, C, and D are baseline data.

