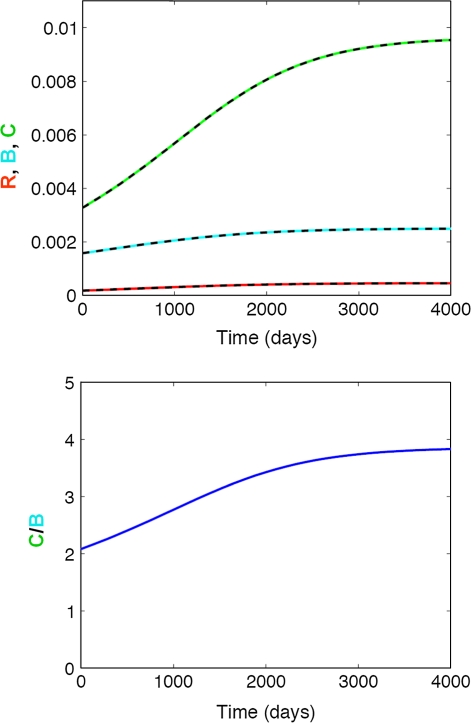
Fig. 2.
Effect of slowly decreasing endogenous estrogen production on bone turnover. Top panel Impact on responding osteoblasts (R, red), active osteoblasts (B, blue), and active osteoclasts (C, green); Bottom panel Impact on the active osteoclasts/osteoblast (C/B) ratio. An increase in the C/B ratio results in bone loss, whereas a decrease results in bone gain. The solid lines represent the simulated change in bone cells using the full model, whereas the dashed lines represent the respective changes using the mathematically reduced model

