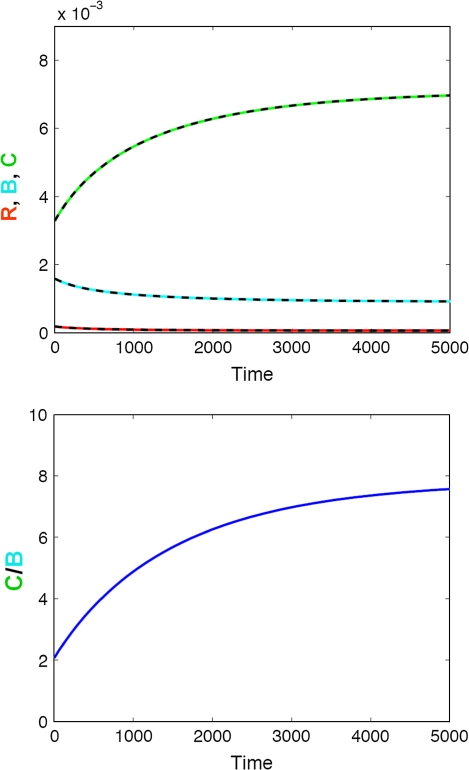
Fig. 5.
Effect of ageing on bone turnover. Top panel Impact on responding osteoblasts (R, red), active osteoblasts (B, blue), and active osteoclasts (C, green); Bottom panel Impact on the active osteoclasts/osteoblast (C/B) ratio. The solid lines represent the simulated change in bone cells using the full model, whereas the dashed lines represent the respective changes using the mathematically reduced model

