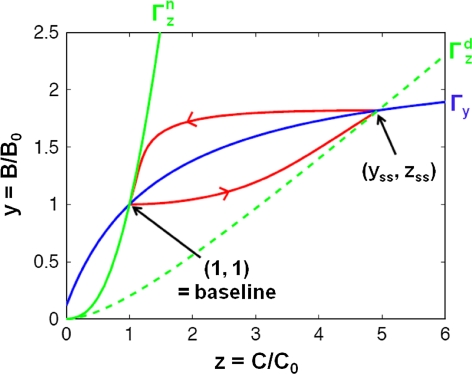
Fig. 9.
Orbit of the reduced system (34) (in red) in the (z,y)-plane. At normal estrogen levels, the system is at baseline (y,z) = (1,1), which is characterized by the intersection point of the solid blue line (Гy) and the solid green line (Гz (normal)). Once estrogen levels change, Гz changes and the system starts moving towards a new steady-state (y ss,z ss). In case of a sudden drop in estrogen levels, realized here by a step-decrease in β, y ss,z ss is now determined by the intersection point of Гy and the new Null Cline Гz(decreased) (dashed green line). As a result, the system starts moving from (1,1) towards (y ss,z ss). Once estrogen concentrations return to their baseline levels, the system moves back to its original baseline (1,1)

