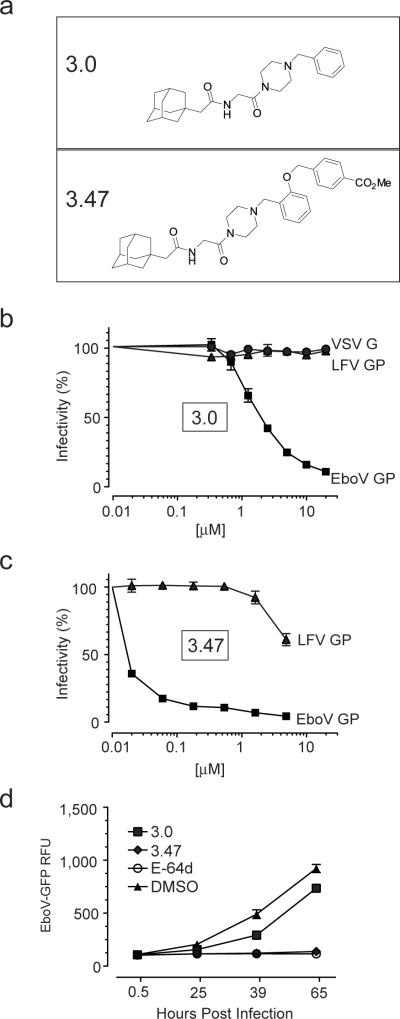
Figure 1. Structure and function of ebolavirus entry inhibitors.
a, Compounds 3.0 and 3.47.
b,c, Vero cells were cultured in media containing increasing concentrations of 3.0 (b) or 3.47 (c) for 90 minutes prior to the addition of VSV particles encoding luciferase (b) or GFP (c) and pseudotyped with either EboV GP, VSV G or Lassa fever virus GP (LFV GP). Virus infection is reported as percent of luminescence units (RLU) or GFP-positive cells relative to cells exposed to DMSO vehicle alone. Data is mean ± s.d. (n=4) and is representative of 3 experiments.
d, Vero cells were cultured in media containing 3.0 [40 μM], 3.47 [40 μM], vehicle (1% DMSO) or the cysteine cathepsin protease inhibitor E-64d [150μM] 90 minutes prior to the addition of replication competent ebolavirus Zaire-Mayinga encoding GFP (moi = 0.1). Results are mean relative fluorescence units ± s.e.m. (n=3).

