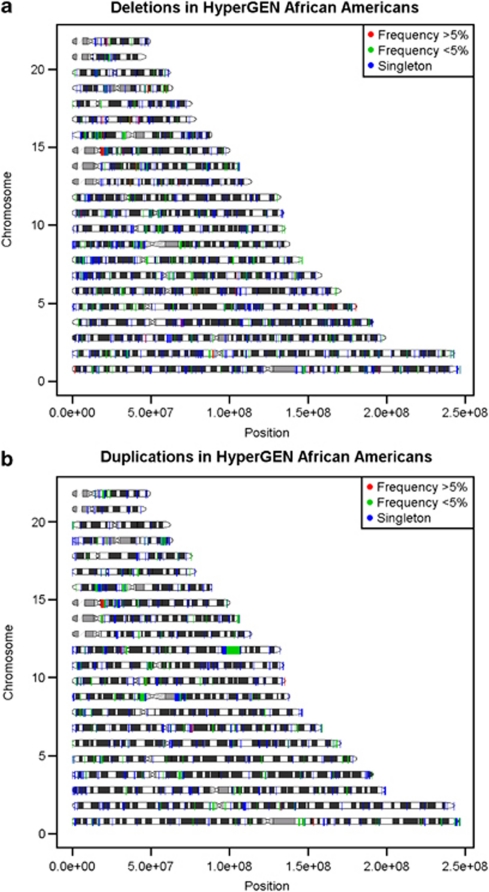
Figure 3.
(a) Distribution of deleted segments throughout the genome. The x axis represents that genomic location in base pair (hg18) of deletions identified by Birdsuite and PennCNV. The y axis represents the chromosomes. (b) Distribution of duplicated segments throughout the genome. The x axis represents that genomic location in base pair (hg18) of duplications identified by Birdsuite and PennCNV. The y axis represents the chromosomes.

