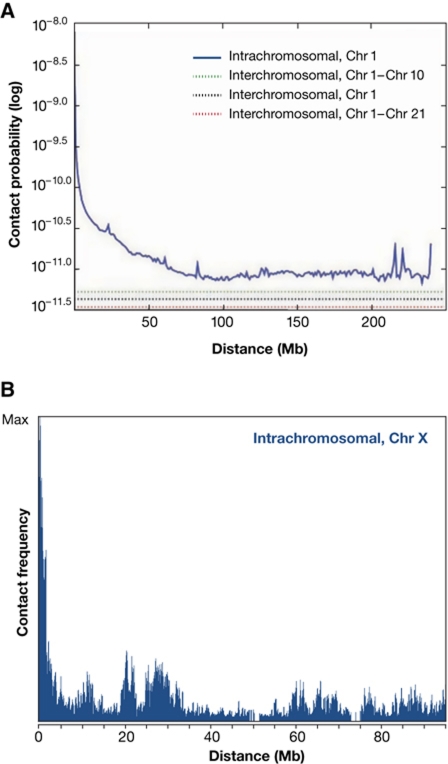
Figure 5.
The relationship between contact frequencies (spatial distance) and the position of sequences on the DNA template. (A) Hi-C experiments showing the average contact probabilities between all pairs of sequences (within and between chromosomes). The average profile shows that with an increasing linear distance the interaction frequencies drop exponentially. (Reproduced with permission from Lieberman-Aiden et al, 2009.) (B) 4C experiment that measures interaction frequencies for an individual locus (‘viewpoint’) versus all other genomic sequences. The same global anti-correlation between distance and contact frequency is seen, but on top specific interactions (peaks) are observed at sequences that are preferentially contacted by the viewpoint.

