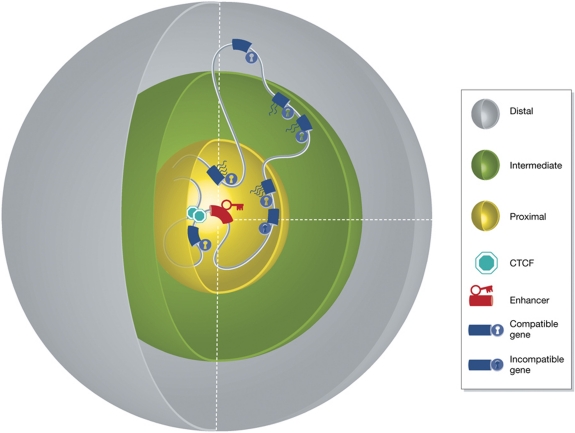
Figure 6.
Spatial distance, enhancer–promoter compatibility and sites of insulation are the main determinants of enhancer-mediated gene expression. This figure represents a three-dimensional model of chromatin ‘in action’, explaining all three rules of engagement by considering regulatory action in three dimensions. Genes proximal to the enhancer in 3D space (in the yellow sphere) have a high probability to be contacted, but activation depends on compatibility and whether or not a gene is isolated from the enhancer (CTCF sites). Compatible genes further away in 3D (in the green sphere) have a decreased probability to be contacted and activated, while compatible genes that too far (grey sphere) will not be activated.

