Figure 4.
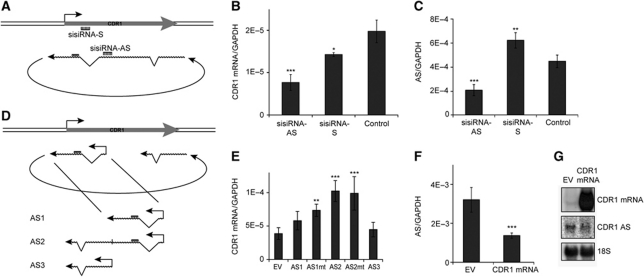
Effect of CDR1 antisense-specific knockdown and overexpression. (A) Schematic illustration showing the target sites for strand-specific sisiRNAs. (B, C) HEK293 cells were transfected with 20 nM strand-specific sisiRNAs targeting the CDR1 antisense RNA (sisiRNA-AS) or mRNA (sisiRNA-S), or a mock control siRNA (Control). After 48 h, RNA levels were evaluated by qRT–PCR using mRNA-specific (B) or NAS-specific (C) primers, respectively. (D) Schematic illustration showing antisense vector design. (E) HEK293 cells were transfected with a vector expressing an antisense transcript harbouring the miR-671 target site (AS1), a vector expressing NAS-mimicking antisense RNA (AS2), a vector expressing a non-target site part of AS (AS3), or an empty vector (EV). The ASmt vectors carry a perfect miR-769 target site instead of the putative miR-671 target. RNA was harvested after 48 h, and the CDR1 mRNA level was quantified by strand-specific qRT–PCR. (F, G) NAS-specific qRT–PCR (F) and northern blot (G) with RNA extracted from cells transfected with a CDR1 mRNA expression vector or an empty vector (EV). Upper, middle, and lower panels show CDR1 mRNA, CDR1 AS, and 18S levels, respectively (G) (*P<0.05; **P<0.01; ***P<0.001).

