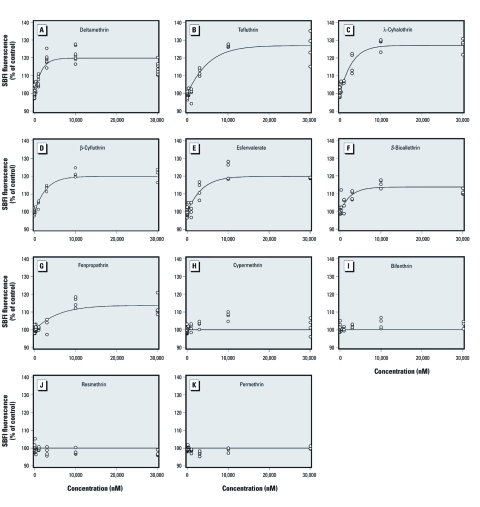
Figure 3.
Concentration–response relationships for 11 pyrethroids-induced Na+ influx: (A) deltamethrin, (B) tefluthrin, (C) λ-cyhalothrin, (D) β-cyfluthrin, (E) esfenvalerate, (F) S-bioallethrin, (G) fenpropathrin, (H) cypermethrin, (I) bifenthrin, (J) resmethrin, and (K) permethrin. Primary cultures of cerebrocortical neurons were loaded with SBFI and then treated with 0.2% DMSO or the indicated concentrations of each pyrethroid for 4.5 min. The levels of fluorescence intensity were summed across the 4.5‑min period, and the background fluorescence was subtracted. Data were then fitted to a nonlinear logistic model to estimate the potency. Data are presented as a percentage of control values, with controls set at 100%. Data points represent individual determinations (wells).

