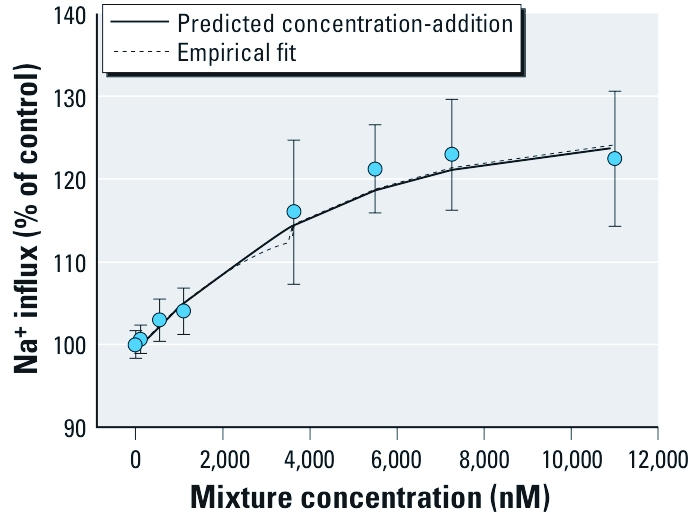
Figure 6.

Observed sample means (circles) and model-predicted mean Na+ influx for a mixture of 11 pyrethroids. Means for the mixture were determined by summing the levels of fluorescence intensity across the 4.5‑min period and subtracting the background fluorescence. Mixture data were then fitted to a nonlinear logistic model, and are presented as the mean ± SD percentage of control values, with controls set at 100%. The predicted response for the mixture, using only single chemical parameters, is not significantly different from the full model, as indicated by the empirical fit. Using this approach, the mean under additivity is estimated for mean values less than the minimum–maximum effect parameter; conservatively, mean values for concentrations above this constraint were set to the full model mean estimates.
