
Figure 1.
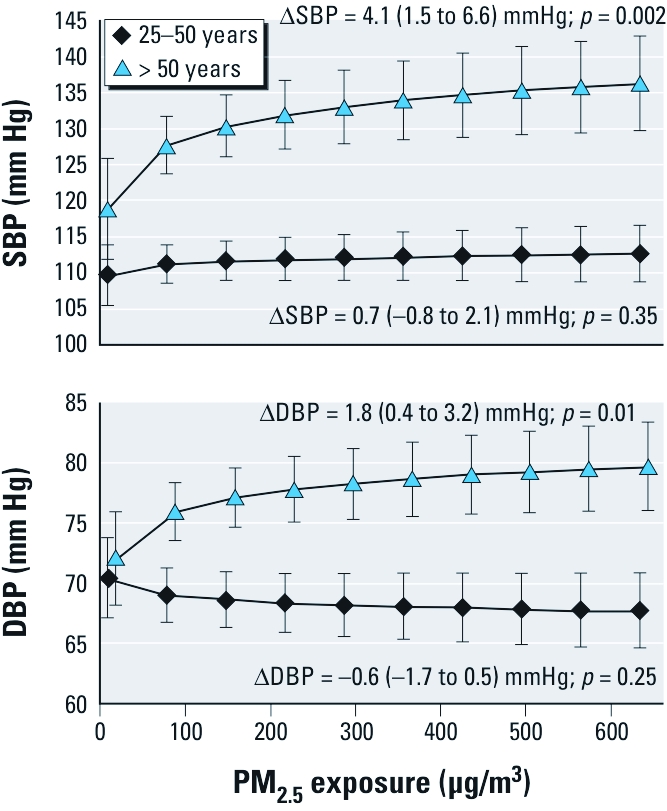
Average SBP and DBP in the population by level of personal exposure to PM2.5 and age.∆ indicates the difference in blood pressure by a 1-unit increase in the log of PM2.5 (as shown in Table 1). Average SBP and DBP in the population (marginal means) were predicted from mixed-effects log-linear regression models (Table 1) using the mean values of age, waist circumference, pedometer steps, SES, salt intake, time of day, and ambient air temperature for the population and the range of PM2.5 exposure observed in our study population. Mean ages were 40 years for the 25–50 age group and 64 years for the > 50 age group. The mean values for waist circumference, pedometer steps, and salt intake for all women were 82 cm, 7,600 steps, and 6 g, respectively, and did not differ between age groups.