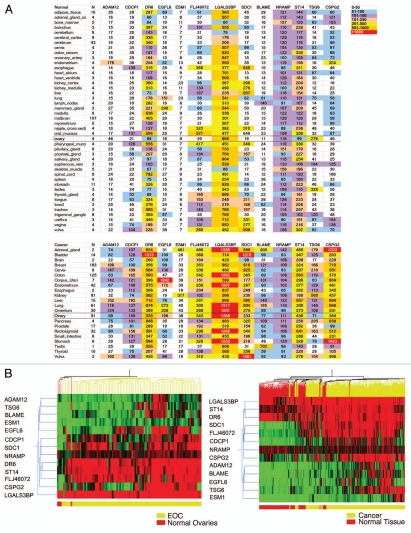
Figure 1.
(A) Heat-map summary of gene expression levels of 13 tumor vascular markers in normal human tissues and solid tumor types based on Affymetrix gene expression analysis. Rows represent different tissues or tumors. In the top part are shown normal tissues. Data represent 355 different tissue samples from five female and five male donors. The numbers of samples analyzed per each organ or tissue are shown in the second column. In the bottom part are shown tumors; data represent 755 tumor samples. The numbers of samples analyzed per each tumor type are shown in the second column. Columns represent genes. Each cell represents averaged Affymetrix gene expression level for each gene in each tissue or tumor. N indicates the number of different samples available for the specified tissue or tumor. For normal brain, the gene expression data set comprised multiple parts of cerebrum or mid brain, and these sites were collapsed. Color coding is arbitrary and based on scale provided at the top of list for quick data interpretation. (B) Unsupervised hierarchical clustering of 13 TVMs in four normal ovaries and 91 ovarian cancer samples derived from the above arrays (left), as well as in all 355 normal tissues and 755 tumors (right). All analyses were conducted using whole tissue Affymetrix expression data.

