Figure 3.
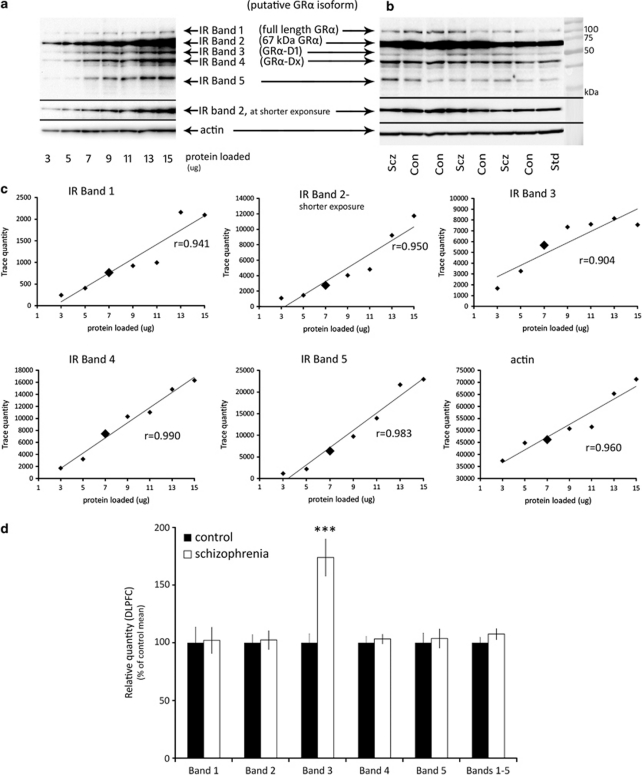
Glucocorticoid receptor (GR)α protein expression in the dorsolateral prefrontal cortex (DLPFC) of Tissue Resource Centre (TRC) schizophrenia and control cases. (a) Loading standard curve western blot. Crude protein homogenate of 3–15 μg was loaded, and the blot probed with P-20 anti-GRα antibody; (b) western blot of representative control (Con), schizophrenia (Scz), and internal control (Std) samples probed with P-20 anti-GRα antibody, displaying five GRα immunoreactive bands (IR bands 1–5) of approximately 105, 67, 50, 40, and 25 kDa; (c) standard curves for IR bands 1–5 and β-actin, demonstrating linear increases in intensity with increasing protein. Large diamonds represent 7 μg of protein, the amount loaded for quantification of the schizophrenia cohort. (d) Average intensities of GRα IR bands in controls (black bars), and schizophrenia cases (white bars). Comparison of the means of schizophrenia and control groups revealed an 80.4% increase in schizophrenia cases relative to controls. By stepwise multiple regression, diagnosis was the only significant predictor of GRα IR band three abundance in the significant regression model (F(1, 72)=15.96, p<0.0005). Normalised quantities are the geometric mean of normalised duplicate runs, displayed as a percentage of the mean of the control group. ***p<0.0005. Error bars represent SEM.

