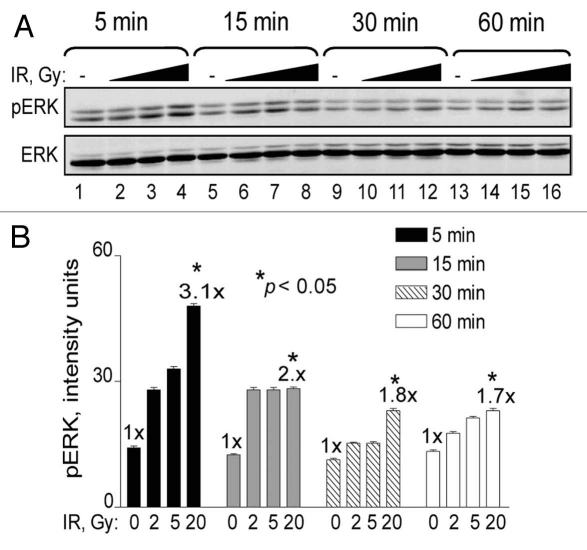
Figure 1.
Time course and IR dose response of ERK phosphorylation. (A) U87 cells were exposed to 0 Gy (lanes 1, 5, 9 and 13), 2 Gy (lanes 2, 6, 10 and 14), 5 Gy (lanes 3, 7, 11 and 15) and 20 Gy (lanes 4, 8, 12 and 16). Cells were collected at 5 min (lanes 1–4), 15 min (lanes 5–8), 30 min (9–12) and 60 min (13–16) and analyzed for ERK phosphorylation by western blotting. ERK denotes equal protein loading. The figure shows representative western blots of triplicate repeats. (B) Densitometry analysis of (A) presented in graph form. Data points, ERK phosphorylation levels plotted against radiation dose. Error bars, SEM; n = 3. Fold (x) denotes changes in p-ERK levels compared to control (0 Gy) normalized to total ERK protein levels. *p < 0.05.

