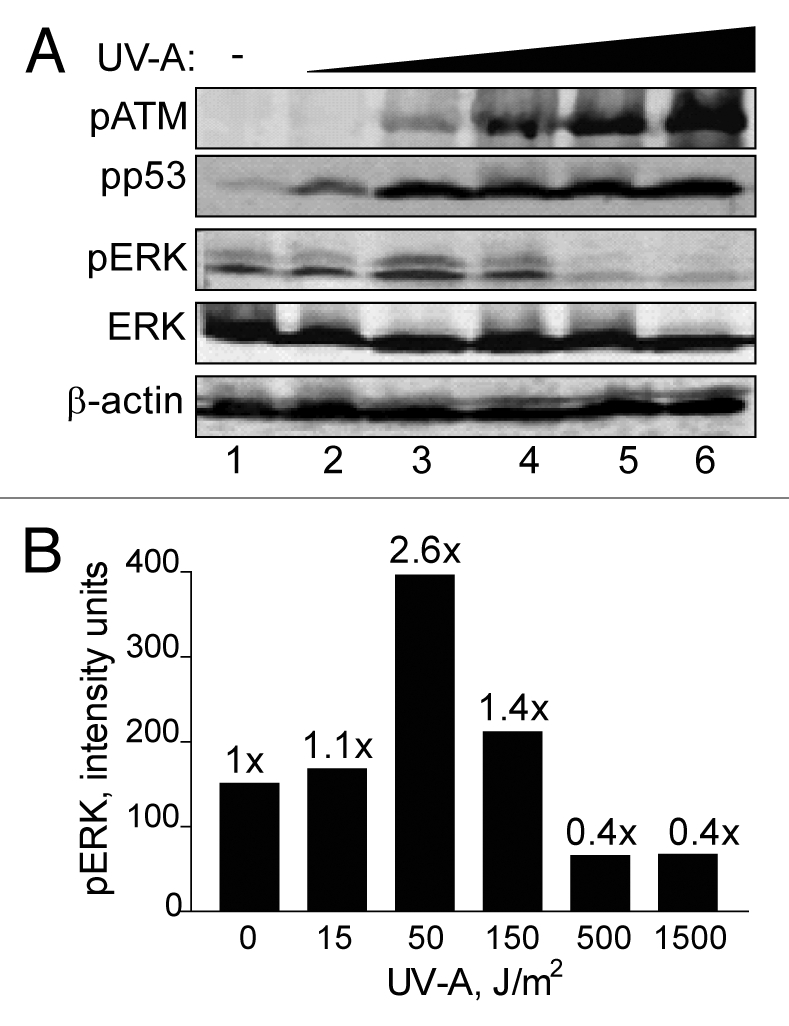
Figure 4.

Brdu photolysis dose response of ERK phosphorylation in HEK293 cells. (A) HEK293 cells were treated by BrdU photolysis with increasing doses of UV-A; 15 J/m2 (lane 2), 50 J/m2 (lane 3), 150 J/m2 (lane 4), 500 J/m2 (lane 5), 1,500 J/m2 (lane 6) or untreated (lane 1). Cells were collected after 3 h for western blot analyses. ERK and β-actin denote equal loading. (B) Densitometic analysis of (A) presented in graph form. Data points, ERK phosphorylation levels plotted against UV-A dose. Fold (x) denotes changes in p-ERK levels compared to control (no UV-A) normalized to total ERK levels.
