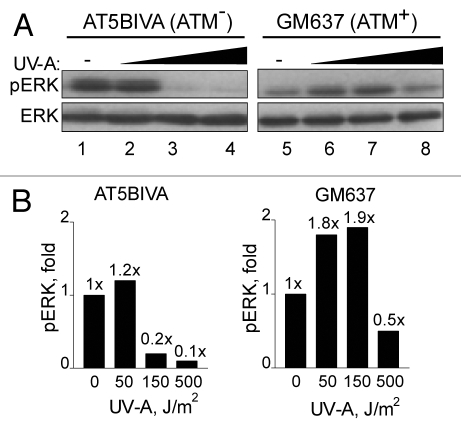
Figure 5.
ERK phosphorylation in response to BrdU photolysis is impaired in A-T cells. (A) AT5BIVA (lanes 1–4) and GM637 (lanes 5–8) cells were labeled with BrdU, treated with Hoechst dye, and irradiated with UV-A [no UV-A (lanes 1 and 5); 150 J/m2 (lanes 2 and 6); 500 J/m2 (lanes 3 and 7); and 1,500 J/m2 (lanes 4 and 8)]. Cells were collected 1 h after irradiation and processed for western blot analyses. ERK denotes equal loading. (B) Densitometic analysis of (A) presented in graph form. Data points, ERK phosphorylation levels plotted against UV-A dose. Fold (x) denotes changes in p-ERK levels compared to control (no UV-A) normalized to total ERK levels.

