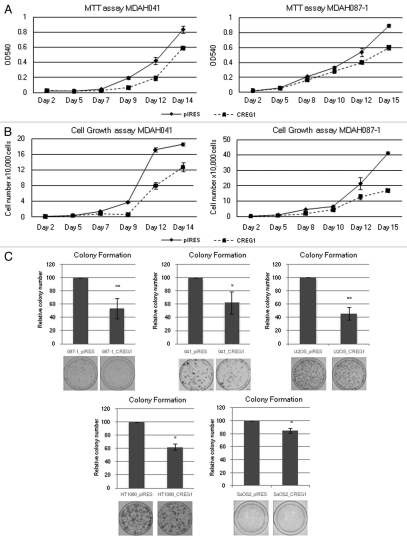
Figure 3.
Ectopic expression of CREG1 decreases cell proliferation in immortal LFS and cancer cell lines. (A) MTT cell proliferation assay of MDAH041 and MDAH087-1 immortal cells. After stable transfection, 2,000 cells were seeded into 24-well plates in triplicate and the MTT assay was conducted every 2 days for 2 weeks. The data point with the standard deviation shows the result from a representative experiment of three independent experiments. (B) Cell proliferation assay by cell counting from MDAH041 and MDAH087-1 after stable transfection. After stable transfection, 1,000 cells were seeded into 24-well plates in triplicate and cell number was counted every 2 days. The data point with the standard deviation shows the result from a representative experiment of three independent experiments. (C) Colony formation assay. After 2 weeks of drug selection, 500–5,000 cells were seeded into 10 cm culture plates in triplicate and colonies were stained by Giemsa after 2 weeks in culture. The bar graphs represent the relative colonies number normalized to control pIRES vector that were set to 100% from at least two independent experiments. Overexpression of CREG1 in immortal LFS, U2OS and HT1080 cells decreases colony number compared with pIRES vector control and slightly decrease colony number in SaOS-2 cells (**p < 0.01; *p < 0.05).

