Figure 5.
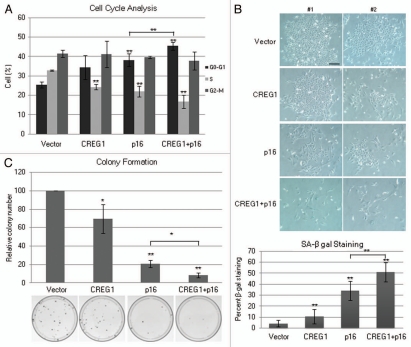
Coexpression of CREG1 and p16INK4a has an additive effect to inhibit cell growth and induce senescence. (A) Cell cycle analysis of U2OS cells transfected with control empty vectors, CREG1, p16INK4a and CREG1 + p16INK4a. Cells were analyzed at day 5 after drug selection. The bar graphs are average percent cell population in G0-G1, S and G2-M phases from three independent experiments. ANOVA analysis was performed to test the differences of each phases in all transfection conditions and showed significance differences of G0-G1 (p < 0.01) and S phases (p < 0.01) but not G2-M (p = 0.68). Student's t-test was performed to compare the effect of each transfection condition with control vector and p16INK4a with combination of CREG1 and p16INK4a in G0-G1 and S phase. **p < 0.01. (B) Cell morphology of U2OS cells cotransfected with CREG1 and p16INK4a, alone and in combination. Transfected cells were β-galactosidase stained and photographed at day 5 after selection. The pictures show two different fields on the culture plate from the representative experiment. Scale bar is 200 µm. The bar graphs show the percent of SA-β-gal stained (blue) cells from three independent experiments. Student's t-test was performed to compare the effect of each transfection condition with control vector and p16INK4a with combination of CREG1 and p16INK4a. **p < 0.01. (C) Colony number of U2OS cells transfected with CREG1 and p16INK4a. The bar graphs show the average relative colony number normalized to the vector control from three independent experiments. 2,000 cells were seeded into 10 cm cultured plate in triplicate at day 5 after double drug selection and the colonies were stained with Giemsa after 2 weeks. ANOVA analysis was performed to test the differences of relative colony number to vector control (p < 0.01). Student's t-test was performed to compare the effect of each transfection condition with control vector to p16INK4a in combination with CREG1, CREG1 alone or p16INK4a alone. **p < 0.01; *p < 0.05.

