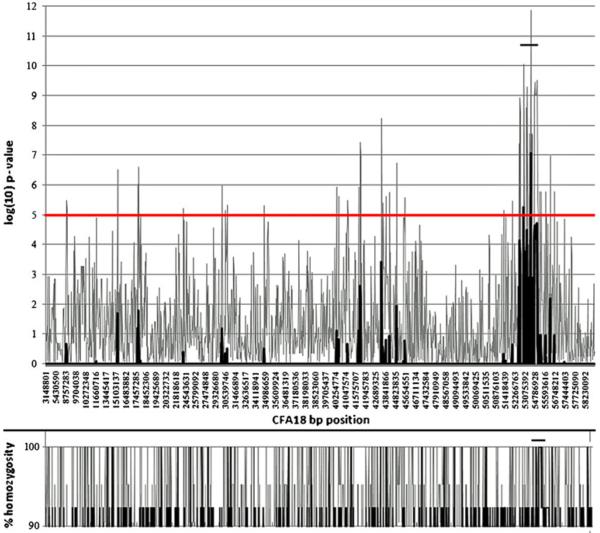
Fig. 3.
Genome-wide association study. Genotyping results are displayed by plotting the negative log10 of the respective p values against the chromosomal (CFA18) position of the SNPs. The highest signal associated with ECLE was observed between positions 53,075,392–54,786,928. Percent homozygosity is shown in the lower panel

