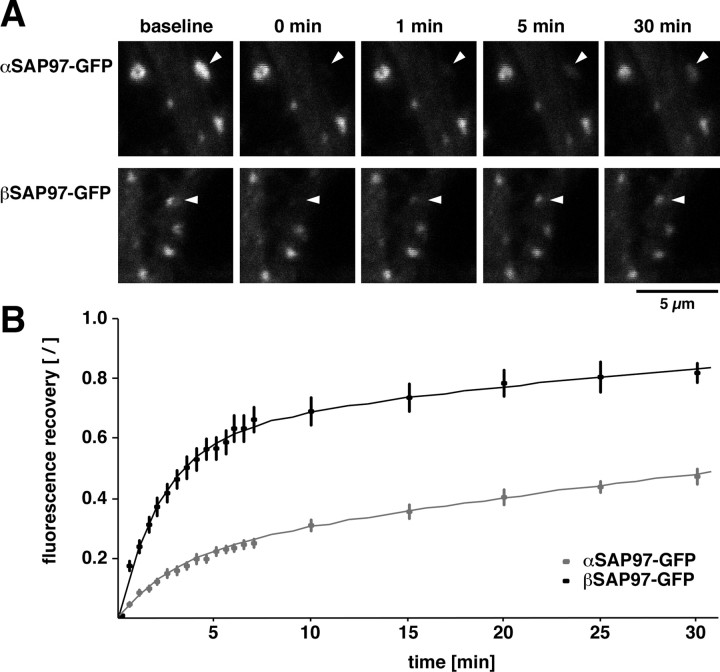
Figure 2.
Synaptic exchange kinetics of α- and βSAP97 isoforms. A, Images of FRAP of α- and βSAP97–EGFP puncta (indicated by arrowheads) on dendrites. B, Fluorescence recovery of α- (gray) and βSAP97–EGFP (black) puncta, normalized to the average intensity of unbleached puncta in the same field of view and set to values between 0 and 100 (see Materials and Methods). Error bars depict ±SEM (n ≥ 18). Curves were fit to the experimental data as described in Materials and Methods.

