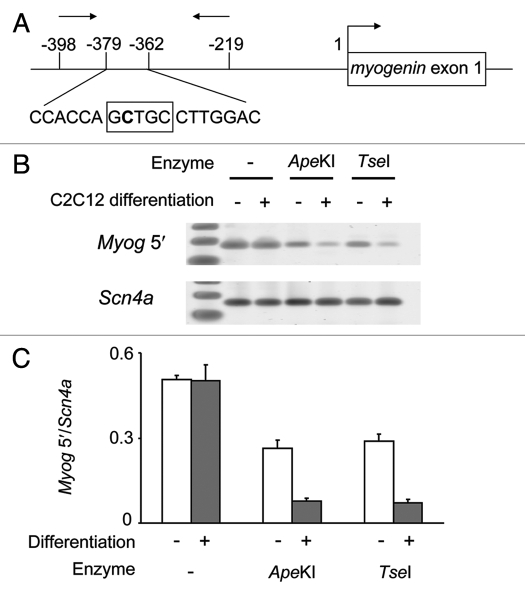
Figure 4.
(A) Diagram showing the site of non-CpG methylation in myogenin promoter region. The target non-CpG site is shown in bold. The box indicates the recognition site for ApeKI and TseI. Arrows indicate primer positions. (B) PCR products of Myog 5′-flanking and Scn4a exon 6 regions after digestion with ApeKI or TseI. (C) Relative amount of PCR products of Myog 5′-flanking region from undifferentiated (white bar) or differentiated (gray bar) C2C12 DNA. DNA digestion and PCR were performed in triplicate.

